Child First Evaluation: Highlights of Outcome Data Analysis for children and families served from August 2010 through December 2022.
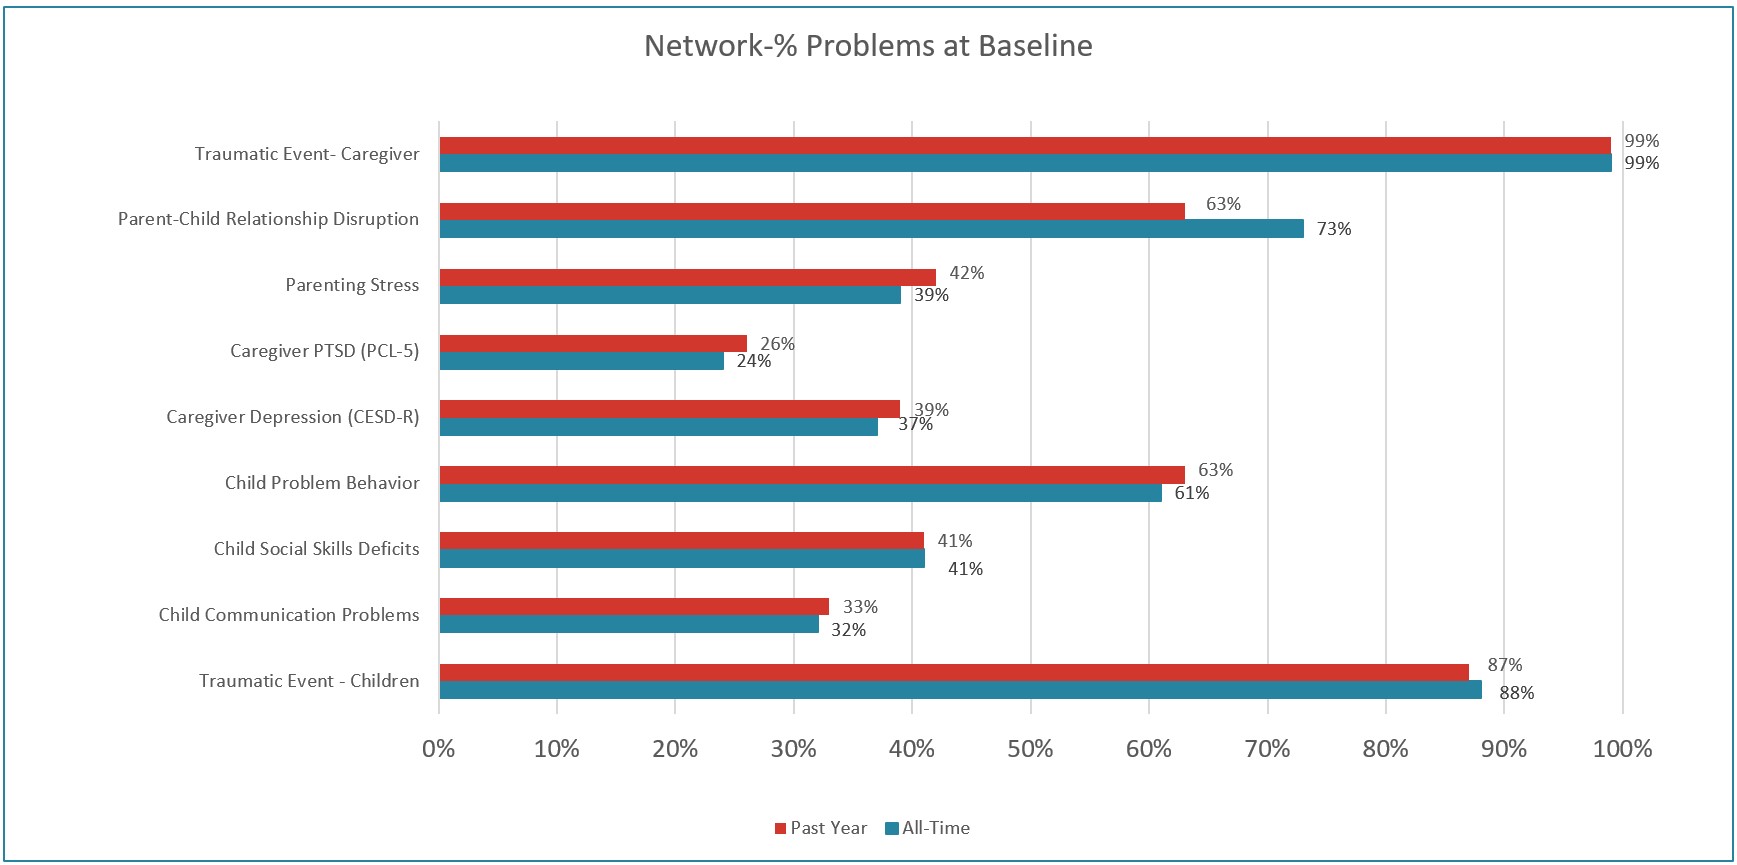
Child First children and families face many challenges. In order to understand and measure both problems and strengths at baseline, assessment data is collected on all identified children and their primary caregivers. Outcome data is collected at 6 months and prior to discharge to assess progress and document change.
Child First collects and analyzes implementation and outcome data on an ongoing basis.
1. Family Characteristics
The data below illustrate the acute characteristics of the families served by Child First.
2022 Outcome Report
2. Overall Improvement
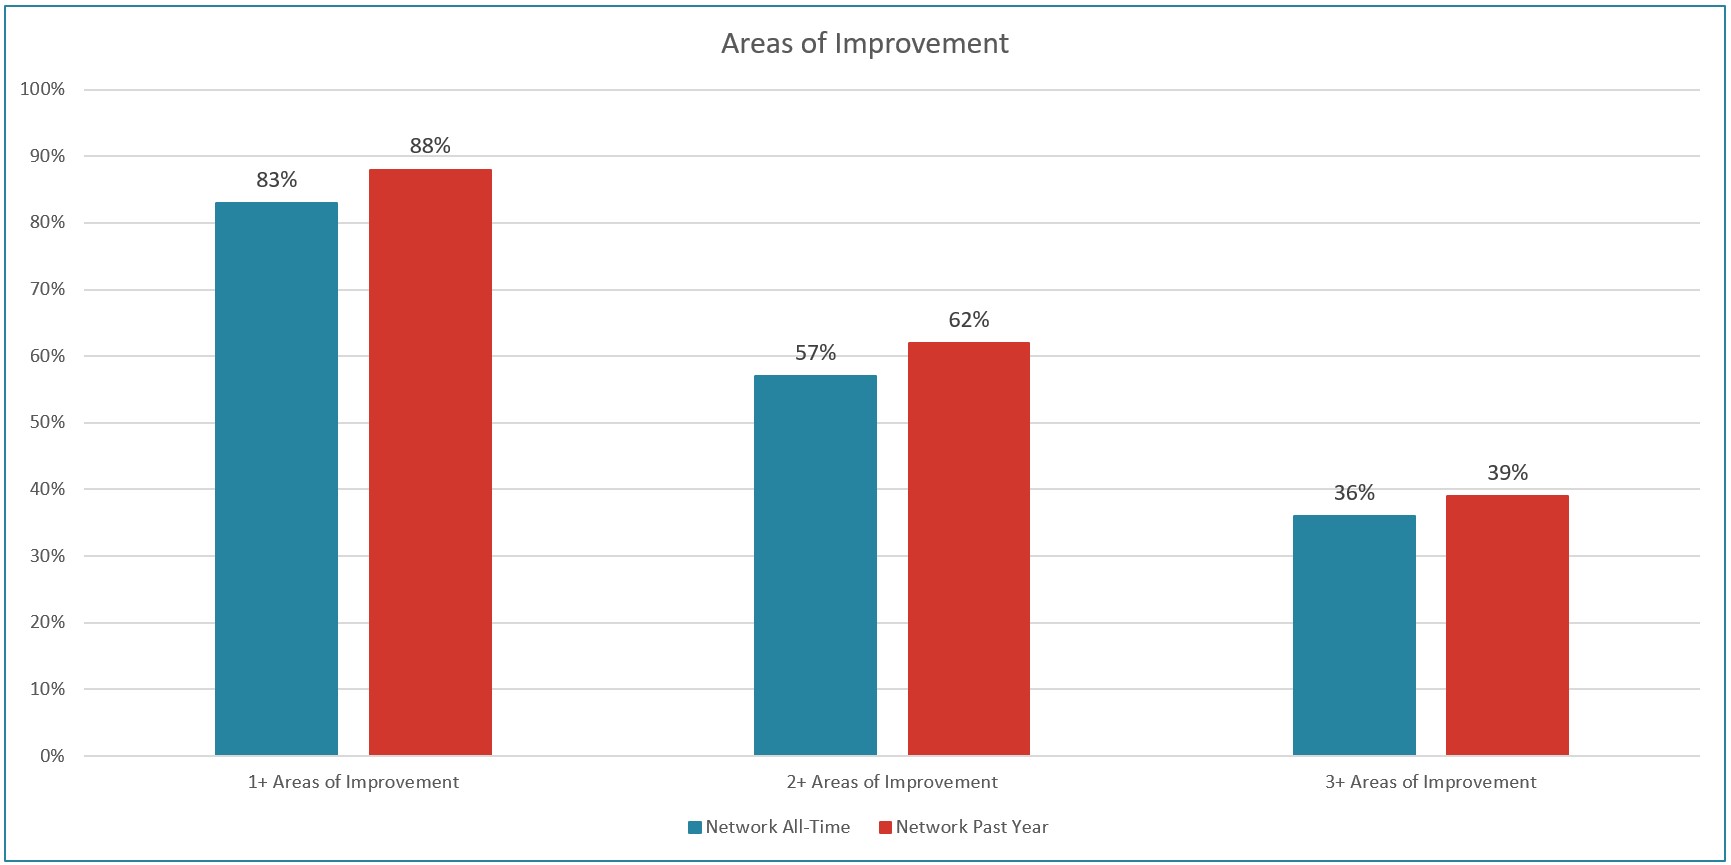
Data from August 2010 through December 2022 was analyzed to determine if there was statistically significant change in functioning in those children or parents who presented with problems in each of the key targeted domains. Improvement is measured by a clinically significant change of 0.5 standard deviation or more between baseline and discharge scores in at least one of the targeted domains.
83% of children and families showed improvement in at least one area, 57% in at least two areas, and 36% in at least three areas.
This graph below outlines the percentage of families who showed improvement in one or more areas.
3. Improvement by Domain
Child First data analysis has continued to show strong outcomes in the following areas:
- Improvement in child language development
- Improvement in child social skills
- Decrease in child behavioral problems
- Decrease in caregiver depression
- Decrease in parent stress
- Strengthening of the parent-child relationship
The following data show the percentage of families who had positive improvements in each domain.
Not only are there significant percentages of families who show improvement in specific areas, outcomes reflect the magnitude of impact, represented by Cohen’s d, that the Child First intervention has on the different areas.
The data below show impressive results among children and families who had documented problems at baseline.
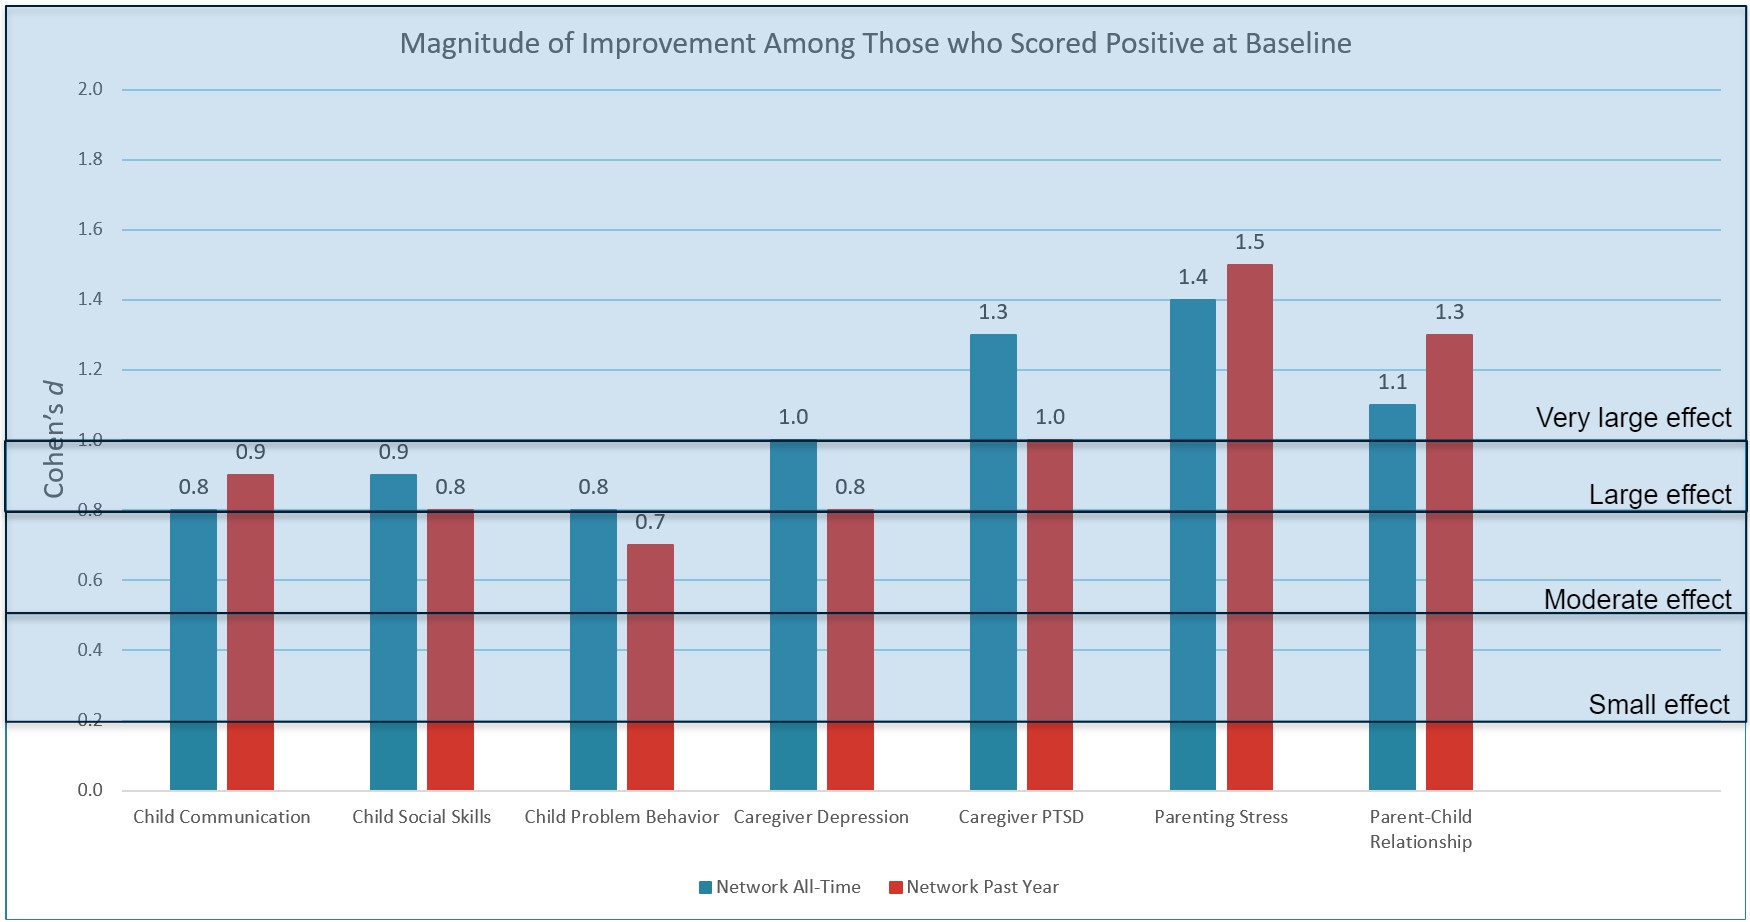
A Cohen’s d or “effect size,” reflects the magnitude or importance of the effect that we have had on the outcome (0.2 is small, 0.5 is moderate, 0.8 is large, and 1.0 is very large). In most analyses, our effect size is large to very large.